by Conor Gormley (Procurement & Supply Chain Analyst)…
What is Spend Analytics?
Spend analytics (also known as Procurement Analytics) is the process of collecting, categorising, and analysing an organisation’s spending data to gain insights into procurement patterns, supplier performance, and cost-saving opportunities. By examining how money is being spent across various categories, suppliers, and departments, businesses can identify areas for improvement, negotiate better contracts, consolidate purchases, and optimise the procurement process. Spend analytics involves leveraging advanced analytics tools and techniques to uncover trends, anomalies, and opportunities hidden within large datasets. These insights enable organisations to make data-driven decisions to reduce costs, mitigate risks, and improve overall efficiency in their purchasing activities. By harnessing the power of spend analytics, businesses can streamline their procurement processes, maximise the value of their spending, and ultimately drive better financial performance.
What are the Typical Savings in Terms of Costs and Other Benefits?
The expected savings from spend analytics can vary widely depending on factors such as the size of the organisation, the industry, the current state of procurement processes, and the level of optimisation already in place. However, it’s not uncommon for organisations to achieve savings ranging from 10% to 20% of their total spend through effective spend analytics initiatives.
For organisations with less mature procurement processes or significant inefficiencies, the potential for savings may be higher, as there is more room for improvement. On the other hand, organisations that already have well-established procurement practices may still benefit from spend analytics by identifying more granular opportunities for cost reduction or process optimisation.
Aside from Hard Cost Benefits, What Other Benefits Might you Expect?
When Spend Analytics methodology is applied, it is normal for the Organisation to enjoy additional benefits outside of “hard cost” savings.
Reduced PO Count:
- By analysing spending data, organisations can identify opportunities to consolidate purchases, negotiate better contracts, and eliminate unnecessary spending, leading to a reduction in the number of purchase orders issued, and reduction or elimination of ad-hoc ordering.
- Streamlining the procurement process through spend analytics can help reduce administrative overhead associated with managing a high volume of purchase orders.
Supplier Performance Evaluation:
- Spend analytics enables organisations to evaluate the performance of their suppliers based on factors such as pricing, quality, and delivery times.
- By identifying underperforming suppliers and fostering strategic partnerships with top-performing ones, organisations can improve supply chain efficiency and mitigate risks.
Process Efficiency:
- Spend analytics can help organisations streamline procurement processes, improve workflow efficiency, and reduce cycle times.
- By automating manual tasks, standardising processes, and implementing best practices identified through spend analytics, organisations can enhance operational efficiency and productivity.
Risk Mitigation:
- Analysing spending data allows organisations to identify and mitigate risks such as supplier insolvency, non-compliance with regulations, or supply chain disruptions.
- By proactively managing risks through spend analytics, organisations can protect their reputation, ensure business continuity, and minimise financial losses.
Improved Supplier Relationships:
- Working more closely with your preferred suppliers enables both Supplier and Customer to collaborate more effectively, have a clearer line of sight on delivery and costs, and enable your suppliers to reduce the costs and overheads associated with your account.
How Does it Work?
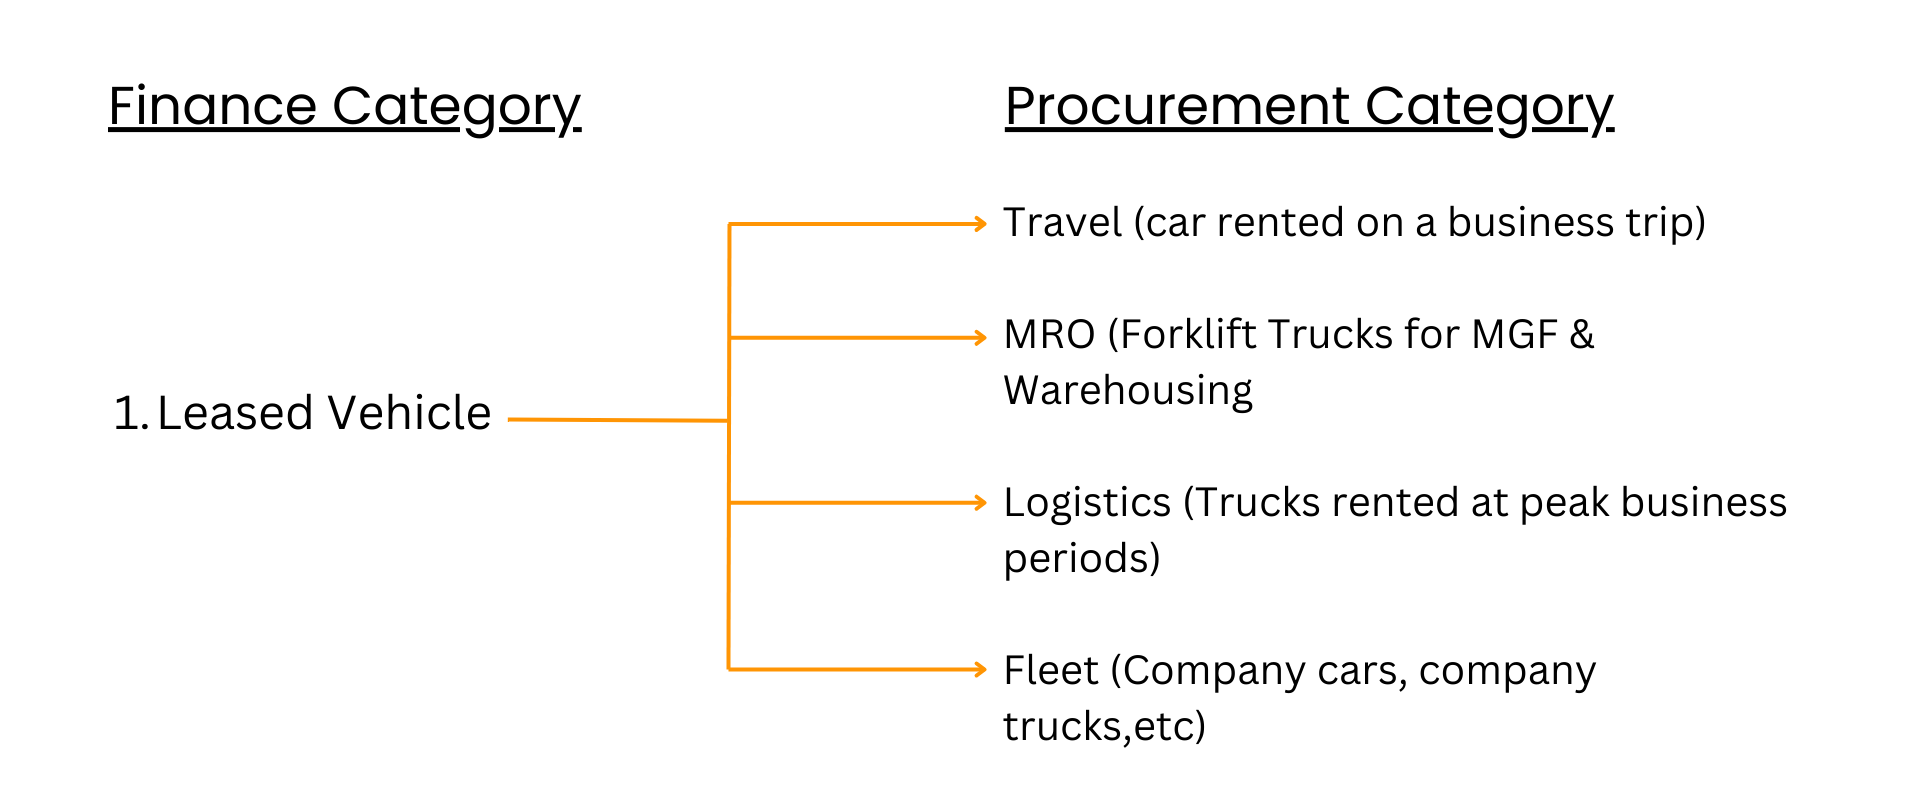
Typically, spend in an organisation is logged against a Finance budget/cost code. An example of this might be “Leased Vehicle”, so spend for any leased vehicle will then be accounted for under that FINANCE category. However, Procurement Categories and Finance categories rarely match. By re-assigning all spend into PROCUREMENT categories, your procurement team can then see spend in each category and subcategory.
See graphic below.
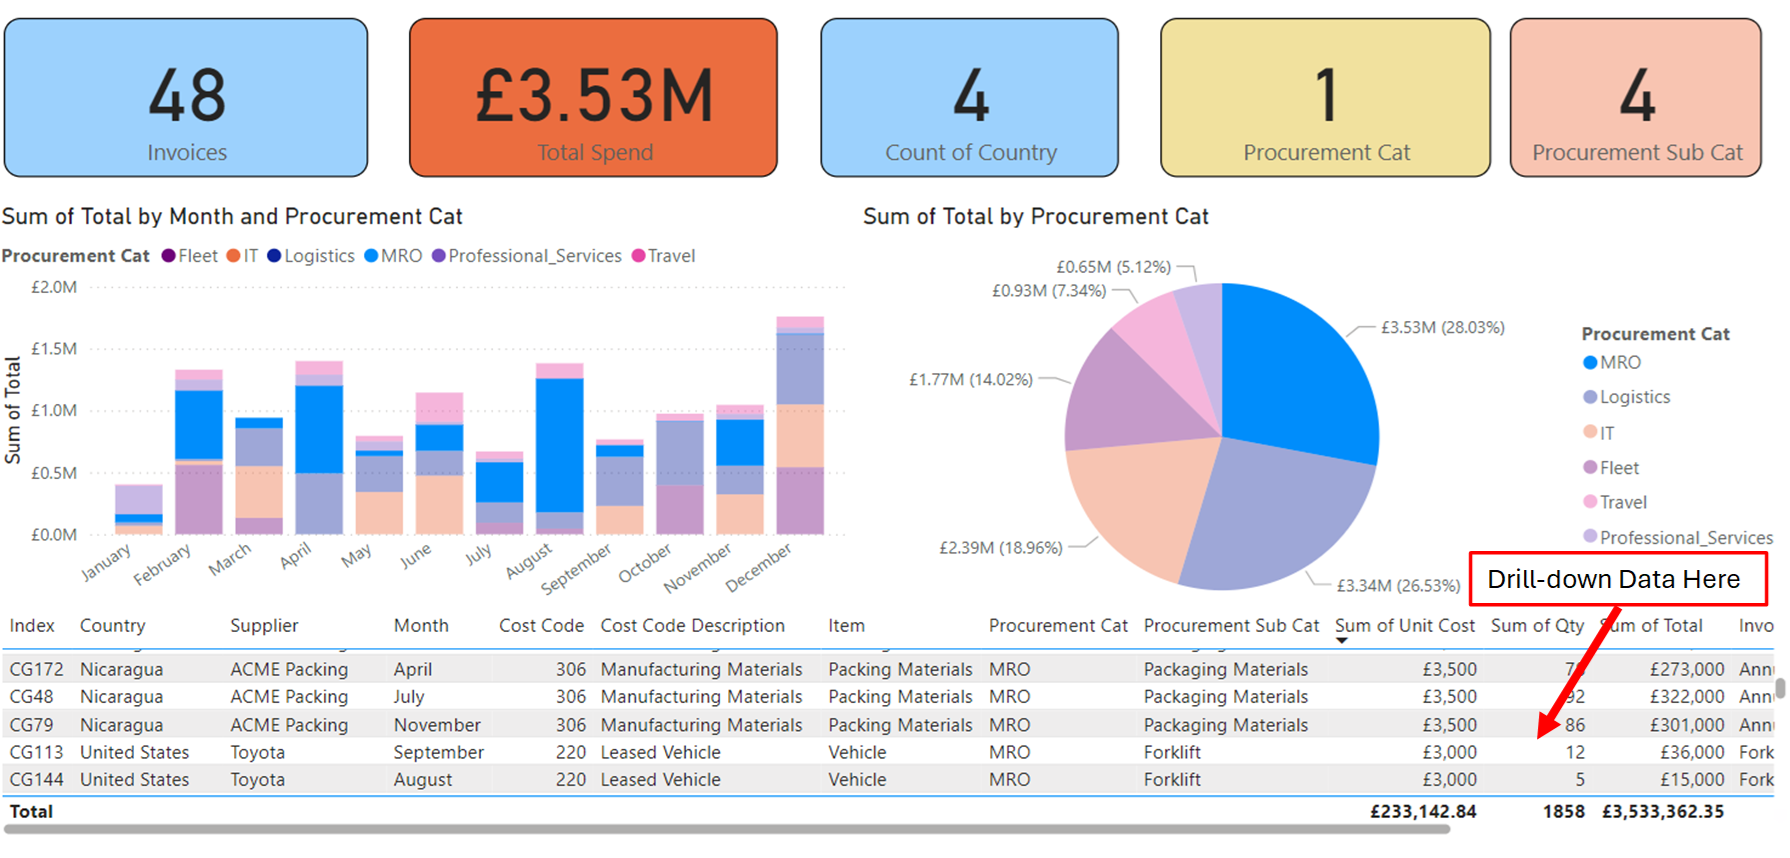
What Would the Output Look Like?
The output is an interactive dashboard (Power Bi) where the Procurement category manager can drill into any and all details associated with their category. Examples below. The user can then analyse the spend by point and click. Power Bi is free to the user. No additional expense. The user can also export selected data, should they wish. We use Power BI as it’s free to the user, and it’s also very compatible with Microsoft Excel (Power BI is a Microsoft tool).
Example below.
Why Choose The Procurement Hive for Analytics?
We use a combination of advanced analytics, statistical analysis, and procurement experience to Extract, Clean and Load (ETL) your data, and then recategorise your data quickly. We can also provide training to your users in an AGILE business environment, where your teams have both input to the tool, and guidance and training throughout.